Johannesburg|South Africa
Statistical Data
Google entries for Johannesburg; Joburg, Jozi 293.000.000
Google entries per inhabitant (metropol. area) 66,12
Founding 1886
http://de.wikipedia.org/wiki/Johannesburg
Population (2011)
City proper 957.441
Metropol. area 4.434.827
http://en.wikipedia.org/wiki/Johannesburg
Area
City proper 334,81 km2
Metropol area 1.644,96 km2
http://en.wikipedia.org/wiki/Johannesburg
Density (inhabitants/km²)
City proper 2.900
Metropol. area 2.700
http://en.wikipedia.org/wiki/Johannesburg
Population history (metropol. area)
1996 2.638.470 [1]
2001 3.226.060 [1]
2011 4.434.830 [1]
2040 6 - 8 million [2]
[1] http://www.gcro.ac.za/sites/default/files/reports/gcro_esri_conference_presentation_may_2013.pdf
[2] http://www.joburg.org.za/images/stories/2013/May/CoJ%20SITPF%20Draft%2013%20May%202013.pdf
Age structure (2011)
0 - 14 23,2%
15 - 64 72,7%
65+ 4,1%
http://beta2.statssa.gov.za/?page_id=1021&id=city-of-johannesburg-municipality
Languages (metropol. area, 2011)
English 19,8%
Zulu 23,1%
Afrikaans 7,2%
Xhosa 6,7%
Sepedi 7,2%
Sesotho 9,5%
Setswana 7,6%
Xitsonga 6,5%
http://beta2.statssa.gov.za/?page_id=1021&id=city-of-johannesburg-municipality
Population structure (metropol. area, 2011)
Black African 76,4%
Coloured 5,6%
Indian / Asian 4,9%
White 12,3%
http://beta2.statssa.gov.za/?page_id=1021&id=city-of-johannesburg-municipality
Climate
Max. temperature Ø (°C) 21,9
Min. temperature Ø (°C) 10,1
Days of rain / year (mm) 713
Rainfall / days 155
http://en.wikipedia.org/wiki/Johannesburg
Households (metropol. area, 2011) 1.434.856
Thereof with access to
tap water in the house 64,7%
Water in the yard 26,9%
Electricity 90,8%
Toilets connected to the waste water system 87,1%
http://beta2.statssa.gov.za/?page_id=1021&id=city-of-johannesburg-municipality
Spread of consumer goods (% of the households owning, 2011)
Cellular 94,4%
Computer 33,6%
Internet access at home or via cellular 32,5%
Television 83,8%
Radio 71,4%
Motor vehicle 38,2%
Fridge 74,6%
Electrical / Gas oven 86,8%
http://beta2.statssa.gov.za/?page_id=1021&id=city-of-johannesburg-municipality
ECONOMY
GDP (Johannesburg; 2013) 48,2 Mrd. EUR
GDP per Capita (Johannesburg; 2013) 7.729 EUR
http://www.joburg.org.za/images/stories/2014/April/idp%20doc%20final.pdf
GDP development (Gauteng)
2003 29.3 billion EUR
2007 46.9 billion EUR
2012 74,5 billion EUR
http://beta2.statssa.gov.za/publications/P0441/P04413rdQuarter2013.pdf
Unemployment rate (2011) 25%
Unemployment among youth 31,5%
http://beta2.statssa.gov.za/?page_id=1021&id=city-of-johannesburg-municipality
GVA (Gross Value Added), by sector, (selected; 2010)
Finance and Insurance 12,7%
Other services 9,3%
Retail Trade 7,6%
Wholesale trade 7,1%
Retail and Maintenance 5,6%
Building Industry 4,8%
Health and Social Service 4,6%
Public Administration 4,2%
http://www.joburg.org.za/images/stories/2013/May/AnnualReport/annexure%20b_%20annual%20performance%20report_190213.pdf
Employees, by sector (2013)
Agriculture 9.071
Mining 13.946
Manufacturing 252.977
Electricity 13.369
Construction 132.486
Trade 486.440
Transport 137.551
Finance 518.858
Community Services 367.820
Households 159.421
Total 2.091.940
http://www.joburg.org.za/images/stories/2014/feb/annexure%20b%202.pdf
Inflation rate (2013) 5,2%
http://de.statista.com/statistik/daten/studie/254740/umfrage/inflationsrate-in-suedafrika/
Lost working days due to strikes / per 1.000 workers
South Africa (2008 - 2012) 440 Tage
EU (2005 - 2009) 30,6 Tage
Great Britain (2008 - 2012) 24,2 Tage
http://www.bdlive.co.za/opinion/letters/2013/11/08/letter-statistics-show-sa-leads-on-strikes
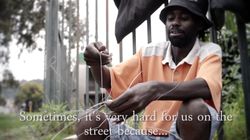
POVERTY
Housholds below the poverty line (Johannesburg),
income less than 108 EUR / month
2001 51,0%
2011 34,9%
income less than 216 EUR / month
2001 66,9%
2011 51,6%
This decline can be largely attributed to the government’s social grants programme, as shown by various research studies. More than 12 million South African are beneficiaries of social transfers, with 62% of grants going to 40% of the poorest households and 82% to the poorest 60% of households. It is widely documented that without social grants poverty would deepen over time rather than improve in South Africa.
http://za.boell.org/sites/default/files/hbs_urban_energy_poverty_report_final.pdf
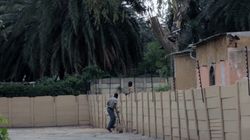
Informal settlements 182
Population 350.000
http://www.joburg.org.za/index.php?option=com_content&id=1949&Itemid=168
Households in informal settlements
2001 212.696 = 21,1%
2011 249.823 = 17,4%
According to Misselhorn (2010), “the actual numbers of households residing in informal settlements is likely to be significantly higher than estimates by Stats SA.” Misselhorn alerts that evidence from actual research reveals that shack counts undertaken by housing officials (aerial surveys supplemented by ground surveys) are more reliable, and sometimes the discrepancy can be as high as 45 percent between Stats SA and municipal department figures. [...] Misselhorn (2010) therefore argues “...that the actual number of households living in informal settlements in South Africa is probably substantially more than the official Stats SA estimate [of approximately 1.96 million households], and that, contrary to what official estimates suggest, there has probably not been a rapid decline in numbers of households living in informal settlements in recent years...”
http://za.boell.org/sites/default/files/hbs_urban_energy_poverty_report_final.pdf
CRIMES
Crimes (Johannesburg; April 2012 - March 2013)
Homicides 2.997
Attempted Homicides 12.288
Robberies 35.869
Burglaries 68.544
http://www.johannesburg.info/saps-crime-under-control/
Rapes (South Africa; 2012/2013)
Reported cases 66.000 [1]
estimated 120.000 [1]
Anteil Vergewaltiger an der männlichen Bevölkerung 28% - 37% [2]
Anteil Teilnehmer an Gruppenvergewaltigungen 7% - 9% [2]
[1] http://ewn.co.za/2014/01/29/Rape-stats-deceptive-due-to-under-reporting
“Rape is one of the most under-reported crimes in South Africa,” noted Shukumisa, an NGO coalition. It points to research, conducted in Gauteng in 2010, that found one in four of women questioned in the study had been raped in the course of their lifetimes, while almost one in 12 had been raped in 2009. But only one in 13 women raped by a non-partner reported the incident to the police, while one in 25 of the women raped by their partner reported this to the police. Rape statistics are, therefore, badly skewed because many women remain silent about sexual violence.
[2] http://www.issafrica.org/uploads/CQ41Jewkes.pdf
Individual feeling of security (Province Gauteng; 2011)
Feel safe during the day 78%
Feel safe during nightly walks 30%
Feel safe at home 73%
Have already once been victim of a crime 23%
http://www.gcro.ac.za/sites/default/files/reports/gcro_overview_october_2013_low_res.pdf
COST OF LIVING
Average income / year (2011)
White 24.644 EUR
Indians / Asians 17.730 EUR
Coloured 9.721 EUR
Black African 4.655 EUR
http://www.joburg.org.za/images/stories/2013/June/2013-16%20idp%2017may2013%20final.pdf
Minimum wage € 0,65 / h
http://www.timeslive.co.za/local/2013/11/22/new-minimum-wage-for-domestic-workers
Prices in Euro
12 Eggs € 1,34
1 kg tomatoes € 1,08
Bread for 2 people for 1 day € 0,64
0.5 l beer in the supermarket € 1,26
1 l of whole fat milk € 0,97
hourly rate for cleaning help € 2,46
Monthly rent for a 85 m2 apartment
in
an expensive area of the city € 874,00
1 l of gas € 0,91
Monthly ticket public transport € 47,00
http://www.expatistan.com
HOUSING
Maboneng (City Improvement District)
2013 / planned
Area ca. 1km2 [1]
Building area 150.000m2 / 1.000.000m2 [1]
Buildings in property 37 / 50 [1]
Inhabitants 500 / 3.000 [1]
Work places 500 / 1.500 [1]
Trees 100 / 350 [1]
Monthly rent € 210 / € 1.260 [2]
Purchase price € 27.300 / € 140.000 [3]
[1] http://www.mabonengprecinct.com/files/8213/7879/2928/Maboneng_Growth_Report_10-13.pdf
[2] http://mabonengcid.co.za/wp-content/uploads/2014/03/Business-Plan-Maboneng-CID-FInal-2014.pdf
[3] http://www.iol.co.za/business/news/maboneng-aims-to-house-3-000-enlightened-individuals-1.1516592
City Improvement Districts worldwide have proven to be one of the most effective and sustainable urban and place management institutions. In Johannesburg, there are 19 legislated CIDs, including areas such as Braamfontein, Main Street, Rosebank, Sandton, Newtown, all of which have experienced dramatic turnarounds and economic revival through such interventions.
http://mabonengcid.co.za/wp-content/uploads/2014/03/Business-Plan-Maboneng-CID-FInal-2014.pdf
6 years ago the Johannseburg investor Jonathan Liebman (who is now 31 years old) started buying low-priced houses in the until then ill-famed district Jeppestown. His company Propertuity renovated the mostly abandoned formerly industrial buildings and storage halls in order to rent them out or sell them as fancy flats, offices, shops or venues.
http://www.zeit.de/lebensart/2014-04/maboneng-johannesburg-gentrifizierung-suedafrika
Inner City Johannesburg (2011)
Rate of vacant private flats 1%
Cheapest flats offered by real-estate agents (1 room) € 115,-
Households with less than 217 € / month 33.861 with 121.899 people
Corresponds to 50% of all households in the Inner City
They are able to spend max. ca. € 65 for rent (= 30% of total income)
http://www.seri-sa.org/images/Minding_the_Gap.pdf
Steyn City (Gated Community)
area 810 ha; half of it parks with trees [1]
Construction costs € 420 million [1]
Completion 2015 [1]
Owner Douw Steyn [1]
Dwelling Units 11.000 [2]
Planted trees 120.000 [3]
Costs of a Steyn House in Steyn City € 17,5 million [1]
Size of the house 3.000m2 [1]
[1] http://www.bdlive.co.za/business/property/2013/10/18/steyn-mansion-sets-r250m-property-record
[2] http://www.urbandynamics.co.za/index.php/latest-articles/109-steyn-city.pdf
[3] http://www.steyncity.co.za/news-room-2/
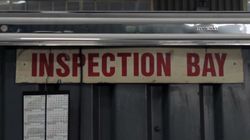
„Bad Buildings“
Estimated number (Johannesburg; 2011) 1.380 [1]
Estimated number (Inner city; 2005) 235 [2]
Estimated population in Bad Buildings more than 250.000 [3]
A [bad] building is one that has deteriorated to such an extent that its market value is below the outstanding debt owed. Living conditions in the building have become extremely harmful to the occupants. The buildings are usually controlled by slumlords who overfill the flats, charge exorbitant rents and allow the buildings to become rundown...Slumlords neglect to pay the rates over to the City, and electricity and water are terminated, further jeopardising the quality of life of the tenants.
[1] http://urpl.wisc.edu/lecturers/Klug%20-%20CLTs%20in%20Jo-burg%20-%20Final-Draft-Nov2013.pdf
[2]http://wiredspace.wits.ac.za/jspui/bitstream/10539/12872/2/Cheap%20rental%20accommodation%20in%20the%20inner%20city%20of%20Johannesburg.pdf
[3] http://www.seri-sa.org/images/Minding_the_Gap.pdf
TRAFFIC
Modal Split (2002)
Cars 36,6%
Pedestrians 30,9%
Mini Bus 23,4%
Train 4,5%
Bus 2,4%
Bicycle 0,2%
http://www.codatu.org/wp-content/uploads/CODATU-Promotion-of-public-transport-walking-and-cycling.pdf
Motor Vehicles
Over a third of the 4,5 million registered cars in South Africa are driven in Johannesburg
http://www.joburg.org.za/index.php?option=com_content&id=1720&Itemid=168
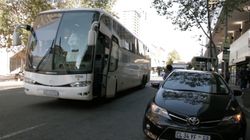
Rea Vaya (Bus Rapid Transit = Bus system with its own routes, not accessible for other cars)
Route Net 59 km [1]
Planned route net 330 km [3]
Stations 48 [1]
Buses (planned for end of 2014) 277 [2]
Daily passengers (2013) 39.000 [2]
[1] http://www.reavaya.org.za/welcome/fast-facts
[2] http://issuu.com/cojdocuments/docs/anual_report_b
[3] http://en.wikipedia.org/wiki/Implementation_of_bus_rapid_transit_by_country#South_Africa